ArcGIS Online: Business Analyst
This self-paced tutorial will introduce users to the popular web-mapping business GIS by Esri, Inc. known as ArcGIS Business Analyst Web App. This tutorial is designed for those who are affiliated with Brock University as the software is available via the Brock University Educational Site License.
ArcGIS Business Analyst Web App is a cloud-based tool used to visualize business, demographics and market data and to perform quick analysis. The software boasts over 6,000 data variables ready to map! This example will look at the need (if there is one) for licensed child care in St. Catharines.
Tutorial
A step-by-step tutorial to introduce curious people to ArcGIS Online Business Analyst:
If you are a Brock University affiliate (i.e. current Brock student, staff or faculty), follow these steps:
- Go to https://arcgis.com
- Click Sign in
- Click the box that says "Your ArcGIS Organization's URL"
- Complete the URL by entering the text "brock"
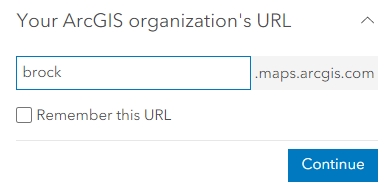
- Click Continue
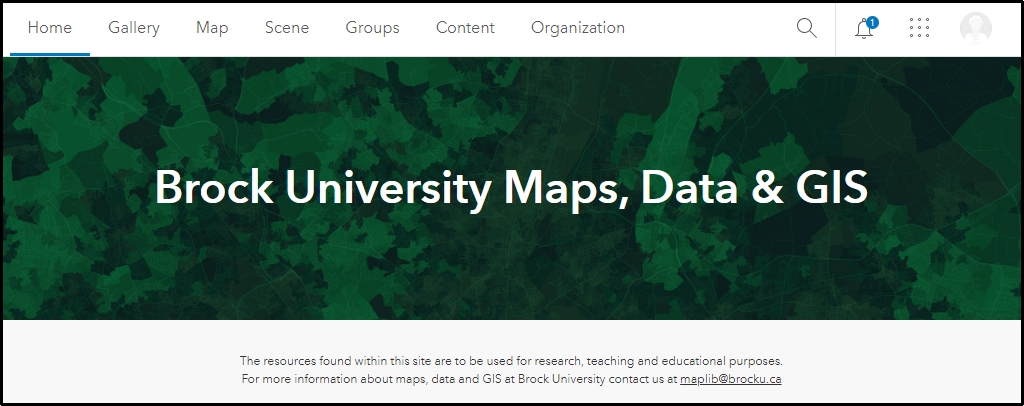
- Click BROCK UNIVERSITY
- This action should direct you to the Brock University authentication page. Enter your Brock username and password, click Sign in and authenticate.
- To access the Business Analyst interface, click the waffle menu
 and select Business Analyst.
- If prompted, create a new project. You will need to give the project a meaningful name and it will be accessible to you the next time you login to Business Analyst. NOTE: Projects can take up to a minute to create.
- At the top of the screen you will see a Data Source dropdown. Make sure Canada is selected.

Side NOTE: Use the Help ? button to learn more about the tools available. You can also watch this introduction video (~3 minutes): https://mediaspace.esri.com/embed/secure/iframe/entryId/1_qjra8tco
Creating maps using the Colour Coded option
- In the search box at the top right of the window, enter an address or location (i.e. St. Catharines, ON) and select a location.
- Use the Zoom tools to the right of the map display or mouse scroll wheel to zoom out until the Niagara Region is visible.
- Click Create maps > Color-coded maps.

The default view shows Median 2024 Household Income. From the options to the left of the map view, notice the sections for "Color", "Style", "Geography" and "Legend".
- Under the Geography heading, change the analysis extent to Current map extent.
- Change the Level of detail to Dissemination Areas. Notice the change on the map.

- Under the Variable section, click the 3 dots menu and select Replace Variable.
- Enter the search term "child care" and hit enter. Browse the list of available content.
- Select the AVERAGE 2024 Child Care Outside the Home. To understand the variable, click the "i" button to the right in the variable search window. This particular variable represents the average expenditure on child care outside the home. To add the data to the map, click the TITLE of the variable.
- Under the Legend section, click Classify Data.
- Click the top class range to see it isolated on the map. Select another one to add it to the selection.

Mapping more than one variable is called Smart Mapping. The next section will explore the Smart Mapping tool.
Smart Map Search
- At the top of the map view, click Create Maps > Smart Map Search.

- Under the Variable lists, look at the very bottom and select Browse all variables. The Data browser reflects all of the demographics and marketing data available through the interface.
- Click the Explore button at the top left of the window to trigger the keyword search option.
- Enter the search term "child care" and hit Enter.
- Click the check box beside the variable 2024 Child Care Outside the Home.
- Click the check box beside the variable 2024 Children at Home: Under 5.
- Click Explore at the top of the window and enter a new search term for "Labour Participation".
- Click the check box beside the variable 2024 Labour Force - Labour Participation Rate.
- Notice the Selected variables box at the top right of the window that indicates how many variables are selected. It should say 3.
- Click Apply at the lower right corner of the window.

The Results panel at the bottom of the screen can be minimized by clicking the double down arrows at the top right of the Results panel.
- From the Variable list: Custom list pane, adjust the variables to reflect the following specifics:
2024 Child Care Outside the Home: change the Calculation from Count to Average to reflect the average expenditure on child care.
2024 Children at Home: Under 5: change the Calculation from Count to Percentage to reflect the percentage of families with children under 5.
It should look something like the following screenshot. The values may vary depending on the zoom extent of your map.

- Using the little circular handles, you can slide the range of values to display only the values of interest. For example, to isolate the Labour Participation Rate at 60% or higher, slide the lower handle up or enter 60 in the value box and hit Enter.
- Adjust the Average Child Care Outside Home to reflect $200 or more.
- Adjust the Children at Home: Under 5 to reflect 20% or higher.
Notice the changes on the map. We now have an idea of the areas of the city that spend money on child care, have kids at home under 5 and participate in the labour force.

- Save Layer. It will take a minute or two to save.
Points of Interest Searching
To find existing child care centres, we will search the Points of Interest database:
- Click Create Maps > Points of Interest Search and enter the term "child care".

- Click Save layer. It may take a minute or two to save.
- To learn more about a particular neighbourhood (or dissemination area), click a highlighted area on the map. You will see a pop-up (see below) with various options: Infographics, Reports, Comparisons, etc.

- Click Reports.
- To choose a report to run, click Select Report and click Family Report Canada.
- Click Run report. Report generation may take a few seconds to complete. You will see a Download link replace the progress bar when it is complete. NOTE: You may also download the report in Excel file format instead of the default PDF.
- Finally, to make a printout, click
 from the buttons along the right side of the map.
There are many other functions and analyses that can be performed using Business Analyst web app. You are encouraged to explore the HELP by clicking  beside your username at the top right of the window. Guided Tours are a great way to explore the technology.
Saving is automatic and the sites, layers and map extent from the previous session are automatically loaded when you sign in.