Intro to ArcGIS Online
This self-paced tutorial aims to introduce users to the popular web-mapping GIS by Esri, Inc. known as ArcGIS Online. This tool is available to public users, however, those who are affiliated with Brock University will have more functionality available via the Brock University Educational Site License.
The scenario we will be looking at is the historic journey that Laura Secord took from Queenston, Ontario to Thorold, Ontario on June 22, 1813 to warn Lt. Fitzgibbon of an impending attack by the Americans. To get a sense of the story, read this article by the late Alun Hughes Following in Laura’s Footsteps and watch this brief Heritage Minute on YouTube.
This story begs for a map. Although many have been created, you will develop an interactive map showing the proposed route that Laura took on that fateful day.
Tutorial
A step-by-step tutorial to introduce curious people to ArcGIS Online:
- Signing In
- The Interface
- Layers & Symbology
- Labels
- Pop-ups
- Access
- Next Steps
If you are a Brock University affiliate (i.e. current Brock student, staff or faculty), follow these steps:
- Go to https://arcgis.com
- Click Sign in
- Click the box that says "Your ArcGIS Organization's URL"
- Complete the URL by entering the text "brock"
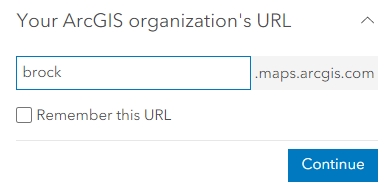
- Click Continue
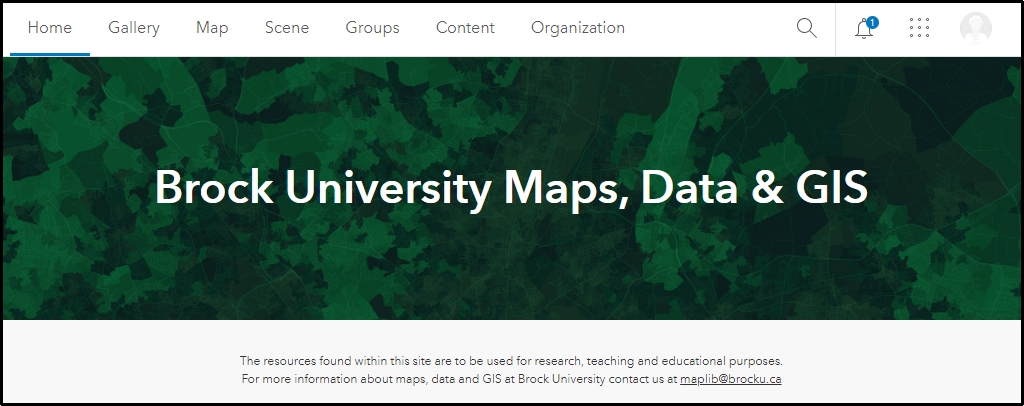
- Click BROCK UNIVERSITY
- This action should direct you to the Brock University authentication page. Enter your Brock username and password, click Sign in and authenticate.
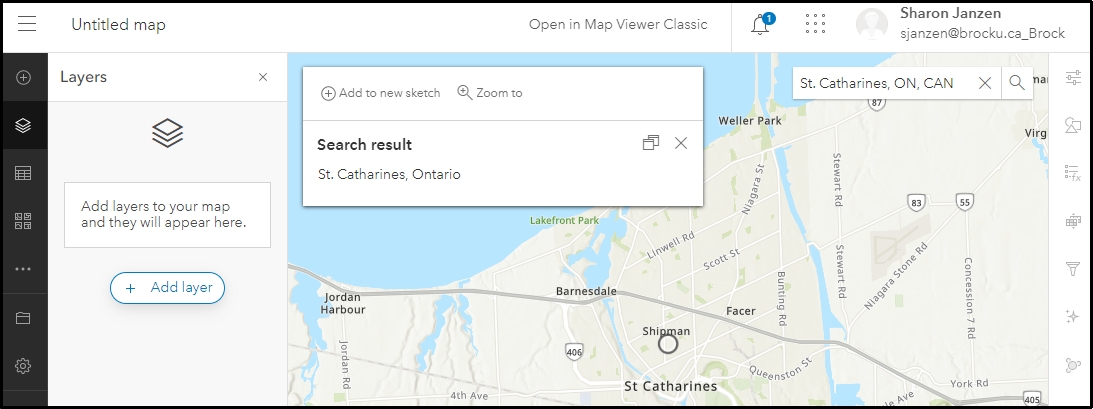
From the menus at the top, click Map. This action opens the default Map Viewer and should look like this:
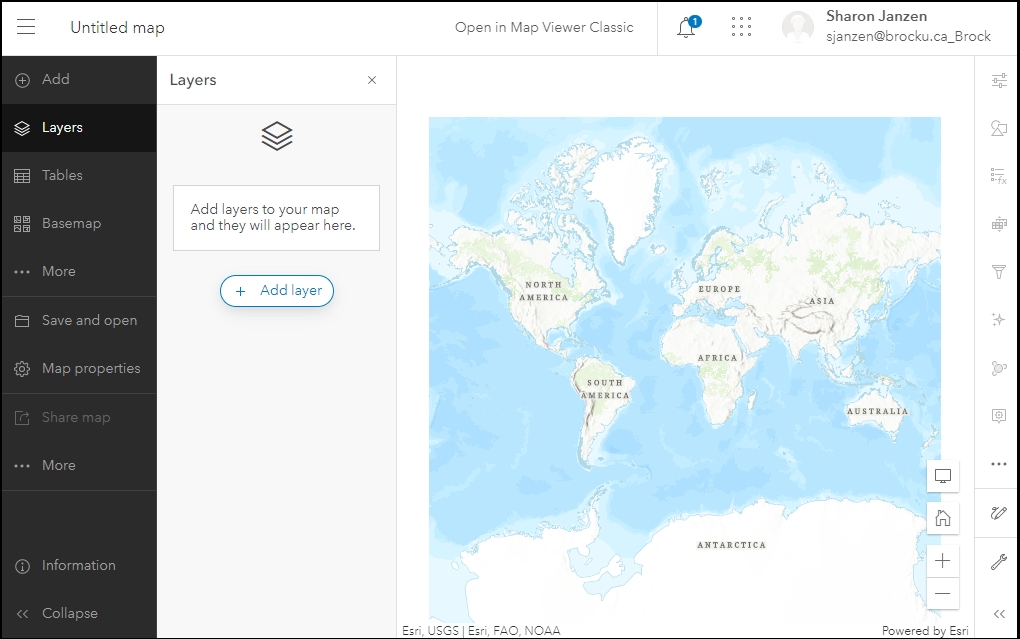
NOTE: If the default viewer does not look like the above screenshot, you may have to click 'Open in map viewer' at the top right.
The Map Viewer is composed of a dark toolbar on the left and a light toolbar on the right. Depending on the tool you have selected, various panels will appear.
At the bottom of each toolbar there is a ‘collapse/expand’ button  .
.
- Click these buttons to collapse or expand the menus.
- Click the ‘hide/show interface’ button
 (bottom right of the map view) to hide/show all menus and panels at once.
- To search for a location, click the magnifying glass
 from the lower right options. Type in a place or address and make a selection from the results.
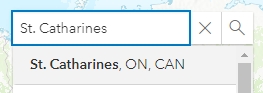
- The map zooms to the location.
-
Use the mouse scroll wheel or the zoom tools to pan and zoom on the map.
The map viewer provides ready-made basemaps to choose from.
- Click the basemap button
 on the left and explore the options. Before continuing, select the Light Gray Canvas option.
- At the top of the Basemap listing options, click Current basemap >

- Click the eyeball icon to turn off the visibility of Light Gray Reference.

- This action turns off the place name labels.

- To save your map, click the Save > Save as button
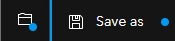
- Enter a unique map name that does not include special characters.
- Click save. All of your work is saved in the Esri cloud, making it accessible from any device with internet connection. For the best results, we recommend using a desktop or laptop.
There are a variety of ways to add data to your map. This tutorial will describe adding layers from within the ArcGIS Online database.
- Click the layers button

- Click

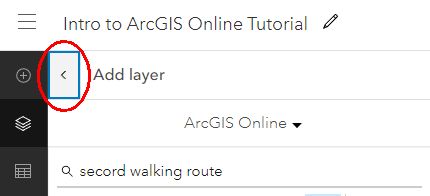
- Click the dropdown beside My Content and select ArcGIS Online. This action will allow you to search all of ArcGIS Online for data layers. For the purposes of this tutorial, 2 layers have been created representing Laura Secord’s walking route and the destinations of each of the 5 phases.
- Enter the search term Secord walking route.
-
Look for the results that match this image:

- Click the small plus sign to add each layer to the map. You should have 2 layers: “Secord Walking Route” and “Secord Walking Destinations”.
-
Click the back arrow beside Add layer at the top left of the panel.

- If necessary, drag and drop the layers such that the ‘destinations’ layer is on top of the ‘route’ layer.
- A layer is selected when there is a vertical blue bar along the side. With the ‘Destinations’ layer selected, click Edit layer style from the right side panel.
- From the Styles panel, under step 2, click Style options below Pick a style.
- Click the symbol below Symbol style.
- Click the dropdown for Basic Point > Basic shapes > Vector Symbols and select Pins.
- Select a pin, click Done then increase the size to 25.
- Click the X at the top of the Symbol style panel and click Done twice.
- Now, let’s touch up the symbols for the walking route. Click the walking route layer to select it.
-
From the Styles panel, click Unique symbols > Style options 
-
Click the colour ramp below “Symbol style” 
-
Adjust the width to 3.
-
Select an Arrow to add an arrowhead to the end of each segment. 
- Click Done twice.
-
Save your map  .
.
-
Your map should look similar to the screenshot below.

- Select the Destinations layer.
- From the menu down the right side of the map, click the Labels tool
 . The Label features panel opens.
- Click

- Under Label Field select the field Destination.
- Click Label style > Edit Label Style to open this panel.
- Change the colour to black.
-
Adjust the placement so the Offset Y is 10.

The features on the map have corresponding attributes in a joined table. These particular layers include a Description field that we will use to populate the pop-ups.
- With the Destinations layer selected, click the Pop-ups tool
 from the right side menu.
- Click Title and replace the default entry with {Destin}. This will give each pop-up the title that correlates to the destination name.

- Delete the Fields list by clicking the 3 dots and selecting Delete.
-
Click Add Content and select Text. In the text box enter {Descript} and click OK. The curly brackets tell the software to pull the information from the field in the table that holds the description.
-
Save your map.

- To access the map at a later time, sign in to ArcGIS.com using the same credentials you used in section one.
- Click Content at the top of the window. You will see a listing of all your ArcGIS Online items.
- Click the title of an item to access the Item Description page.
- Click the thumbnail image to open in the map viewer.
- Now that you have a map created, why not try out ArcGIS StoryMaps for sharing your story with others? Check out the tutorial from the navigation links to the left.